Kubernetes — How it works
What is Kubernetes
Kubernetes:
open source software for orchestrating containerized applications — automating their deployment, scaling, and coordination in a cluster. Supports major containerization technologies, including Docker, rkt, and hardware virtualization technologies can also be supported. The original version was developed by Google for internal needs, and the system was later transferred to the Cloud Native Computing Foundation.
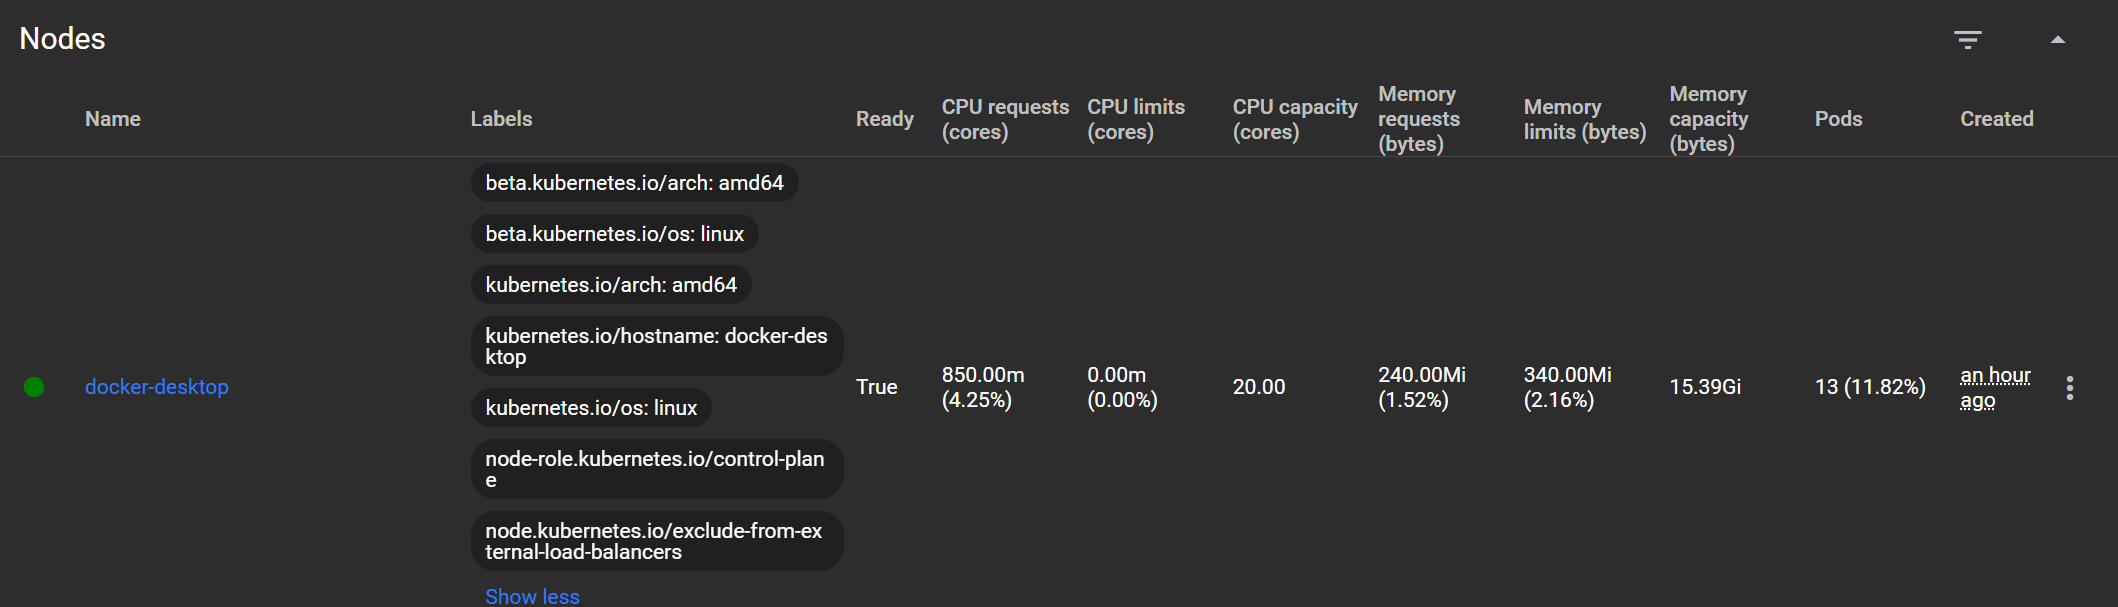
Node:
is a separate physical or virtual machine on which application containers are deployed and run. Each node in the cluster contains services for running applications in containers (for example, Docker), as well as components designed for centralized node management.
Pod:
the basic unit for running and managing applications: one or more containers that are guaranteed to run on a single node, are provided with resource sharing and interprocess communication, and are provided with a unique IP address within the cluster.[16] The latter allows applications deployed on a pod to use fixed and predefined port numbers without the risk of conflict. Pods can be managed directly using the Kubernetes API or their management can be delegated to a controller.

Volume:
a shared storage resource for use by containers deployed within a single pod.
Deploying the application:
You describe the application in a manifest (usually a YAML file): how many replicas, container image, resources, environment variables, etc.
Example deployment.yaml:
apiVersion: apps/v1kind: Deploymentmetadata: name: my-appspec: replicas: 3 selector: matchLabels: app: my-app template: metadata: labels: app: my-app spec: containers: - name: app image: my-app:latest ports: - containerPort: 8080kubectl:
command utility for managing a Kubernetes cluster.
It allows you to send commands and receive information from the Kubernetes API Server, that is, it is the main tool for working with the cluster through the terminal.
What you can do with kubectl:
Create, update and delete resources (Pods, Deployments, Services, etc.)
Get information about the state of the cluster, applications and nodes
Connect to running containers (via exec)
View logs
Scale applications
Debug crashes (describe, events)
Apply configurations from YAML files (apply, create)
Architecture
kube-apiserver:
REST interface to the entire cluster. Accepts commands from kubectl, other services, and clients. This is the entry point to the entire system.
Language: Go
Format: Binary file, runs as a process or container
Protocols: HTTP/HTTPS (REST API)
Functions: receiving commands (kubectl, UI, CI/CD), validation, authorization, writing to etcd
etcd:
distributed key-value storage. It stores the entire state of the cluster. This is a separate process, often moved to its own node (or several for fault tolerance).
Language: Go
Format: standalone binary (etcd), often run as a systemd service or container
DB type: key-value (Raft cluster)
Functions: storing all state: Pods, Deployments, ConfigMaps, etc.
kube-scheduler:
selects which worker node to run a Pod on based on resources, taints, affinity, etc.
Language: Go
Format: binary
Functions: When a new Pod appears, selects a suitable node based on available resources, affinity, taints, etc.
kube-controller-manager:
monitors objects in etcd (for example, that there should be 3 replicas of a Pod) and brings the cluster to the desired state. Includes: Node controller, Replication controller, Deployment controllerJob controller, etc.
Language: Go
Format: binary file
Functions: Contains several controllers (e.g. for ReplicaSets, Endpoints, etc.), each of which monitors the current objects in etcd and creates/destroys resources as needed.
cloud-controller-manager (optional):
Manages cloud provider resources: balancers, disks, IP.
Connects to the provider's API (AWS, GCP, etc.) via SDK
Responsible for creating LoadBalancers, disks, routes, etc.
Where they are launched:
On the master node
Most often - in the form of containers launched via kubelet and manifests in /etc/kubernetes/manifests/*.yaml (in a kubeadm cluster)
How are they related:
Everything talks to kube-apiserver (even controllers and scheduler)
kube-apiserver talks to etcd
No component has direct access to etcd except apiserver
kubelet:
an agent that interacts with the control plane and monitors Pods on a node, and launches containers on selected nodes.
kube-proxy:
implements network routing and balancing, configures iptables or ipvs for traffic routing.
Container runtime:
for example, Docker or containerd, runs containers.
Scaling and self-healing:
If a Pod crashes, the ReplicaSet controller automatically starts a new one.
You can scale your application manually (kubectl scale) or automatically (HPA).
Kubernetes monitors the health of nodes and restarts Pods on others if something goes wrong.
Namespace
This is a logical isolation of resources within a single cluster.
Why do you need Namespace:
Separation of environments: dev, test, prod
Restricting Access by Commands (RBAC)
Resource management (CPU/memory limits can be set at namespace level)
Configuration and network isolation
What is isolated in Namespace: Pods, Services, ConfigMaps, Secrets, Deployments, etc.
Not isolated: Nodes, Persistent Volumes (no PVC), ClusterRoles / ClusterRoleBindings
Standard Namespaces:
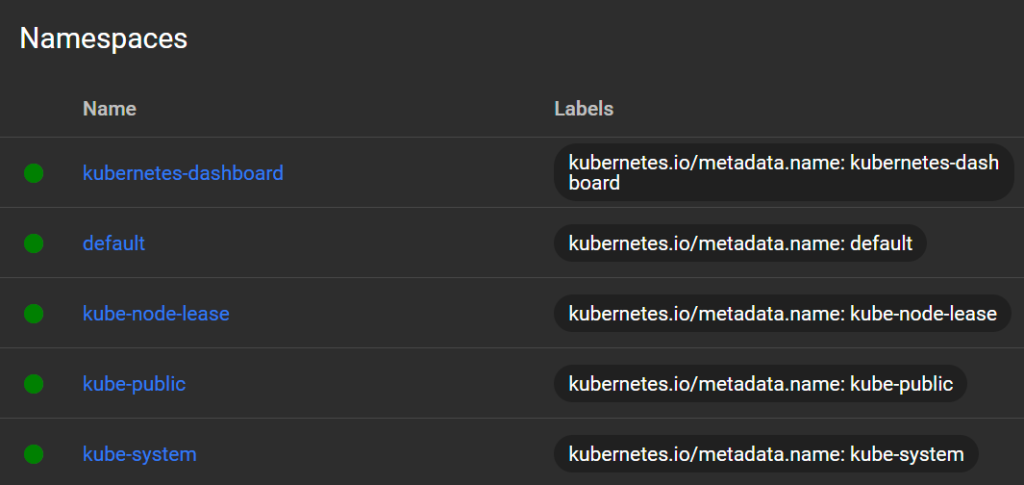
kubernetes-dashboard:
This is a namespace created automatically when you installed Dashboard. It contains:
Pod Dashboard (UI interface)
Dashboard Service
Service accounts (admin-user, dashboard-admin)
All objects related to the control panel
Used only for Dashboard. It is better not to place your applications there.
default:
The default base namespace. If you don't specify -n or --namespace, all resources are created here.
Well suited for tests and simple applications
But for real projects it is better to use separate namespaces (dev, prod, team-a)
kube-node-lease:
Technical namespace for internal lease objects between kubelet and kube-controller-manager.
Used to check nodes are alive
Provides scalability of heartbeat signals from nodes
Usually not needed for manual work, but important for cluster stability.
kube-public:
A public namespace accessible to everyone (including unauthenticated users, if allowed).
Typically used for public information about a cluster.
For example, cluster-info config map (using kubectl cluster-info)
Does not contain critical objects by default. Can be used as a source of open data.
kube-system:
A critical namespace. All Kubernetes system components reside here:
DNS (CoreDNS)
Network plugins (e.g. CNI)
kube-proxy
kube-controller-manager (if not on a separate node)
Storage provisioners and more
Never post your apps here.
Load balancing
Intra-cluster balancing (Service → Pod)
When you create a Service of type ClusterIP, NodePort, or LoadBalancer, Kubernetes automatically distributes traffic to the Pods that correspond to that service.
How does this work
Service has an IP address.
When someone accesses this IP, kube-proxy redirects the traffic to one of the Pods that matches the service selector.
kube-proxy uses:
iptables (default)
or ipvs (optimized mode)
Traffic is distributed evenly between live Pods (round-robin).
Incoming HTTP(S) traffic - via Ingress
If you want to accept external HTTP(S) traffic, use Ingress + Ingress Controller (e.g. NGINX, Traefik, Istio).
How does this work:
Ingress Controller receives all external HTTP traffic
Based on Ingress rights, it determines which Service to forward traffic to.
Then the traffic goes according to the usual scheme Service → Pod
The controller can use Sticky Sessions, Path-based routing, TLS, weight balancing, etc.
External balancing (in the cloud)
If you are using a Service of type LoadBalancer and the cluster is deployed in the cloud (AWS, GCP, Azure):
Kubernetes requests creation of external Load Balancer from cloud API
The balancer receives a public IP and routes traffic to the node's NodePorts
External balancing works outside the cluster, like a classic cloud LB.
Examples of balancing:
ClusterIP (internal service):
automatically balances traffic between Pods app=my-app
apiVersion: v1kind: Servicemetadata: name: my-servicespec: selector: app: my-app ports: - port: 80 targetPort: 8080 type: ClusterIPIngress (HTTP):
NGINX Ingress Controller will route requests to web service, which balances between Pods
apiVersion: networking.k8s.io/v1kind: Ingressmetadata: name: web-ingressspec: rules: - host: app.local http: paths: - path: / pathType: Prefix backend: service: name: web-service port: number: 80Example of running Kubernetes locally
The easiest way is to enable it in Docker Desktop
https://docs.docker.com/desktop/setup/install/windows-install
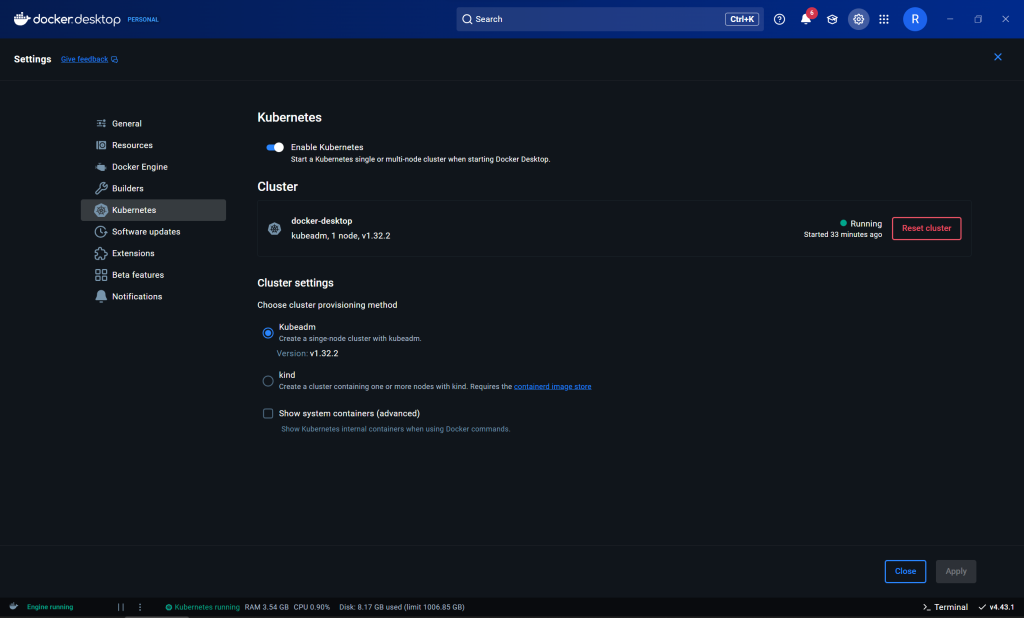
or install and run Minikube
https://minikube.sigs.k8s.io/docs/start
or install and run Kind (Kubernetes IN Docker)
Basic kubectl commands
Working with resources:
kubectl get pods # list of Podskubectl get pods -A # all Pods in all namespaceskubectl get services # list of serviceskubectl get deployments # list of Deploymentskubectl get nodes # list nodeskubectl get all # all resources of the current namespaceExamples:
kubectl get pods:NAME          READY   STATUS    RESTARTS   AGEubuntu-test   1/1     Running   0          27m
kubectl get pods -A:NAMESPACE              NAME                                         READY   STATUS    RESTARTS   AGEdefault                ubuntu-test                                  1/1     Running   0          28mkube-system            coredns-668d6bf9bc-spsws                     1/1     Running   0          41mkube-system            coredns-668d6bf9bc-t9jkx                     1/1     Running   0          41mkube-system            etcd-docker-desktop                          1/1     Running   0          41mkube-system            kube-apiserver-docker-desktop                1/1     Running   0          41mkube-system            kube-controller-manager-docker-desktop       1/1     Running   0          41mkube-system            kube-proxy-xd582                             1/1     Running   0          41mkube-system            kube-scheduler-docker-desktop                1/1     Running   0          41mkube-system            storage-provisioner                          1/1     Running   0          41mkube-system            vpnkit-controller                            1/1     Running   0          41mkubernetes-dashboard   dashboard-metrics-scraper-5bd45c9dd6-55lj2   1/1     Running   0          35mkubernetes-dashboard   kubernetes-dashboard-79cbcf9fb6-q792g        1/1     Running   0          35m
kubectl get services:NAME         TYPE        CLUSTER-IP   EXTERNAL-IP   PORT(S)   AGEkubernetes   ClusterIP   10.96.0.1    <none>        443/TCP   41m
kubectl get nodes:NAME             STATUS   ROLES           AGE   VERSIONdocker-desktop   Ready    control-plane   33m   v1.32.2
kubectl get all:NAME              READY   STATUS    RESTARTS   AGEpod/ubuntu-test   1/1     Running   0          29mNAME                 TYPE        CLUSTER-IP   EXTERNAL-IP   PORT(S)   AGEservice/kubernetes   ClusterIP   10.96.0.1    <none>        443/TCP   42m
Diagnostics and debugging:
kubectl describe pod <name> # Pod detailskubectl logs <pod> # container logskubectl logs <pod> -c <container> # logs of a specific containerkubectl exec -it <pod> -- bash # terminal in container (bash/sh)kubectl top pod # resource usage (if metrics-server is installed)Examples:
kubectl exec -it ubuntu-test -- bash:root@ubuntu-test:/#Resource Management:
kubectl apply -f <file.yaml> # create or update resourceskubectl delete -f <file.yaml> # delete resourceskubectl delete pod <name> # delete podkubectl create -f <file.yaml> # create resources (new only)kubectl scale deployment <name> --replicas=3Context and namespace:
kubectl config get-contexts # all clusterskubectl config use-context <name> # switch to another clusterkubectl config current-context # current contextkubectl get pods -n <namespace> # specify namespaceExamples:
kubectl config get-contexts:CURRENT   NAME             CLUSTER          AUTHINFO         NAMESPACE*         docker-desktop   docker-desktop   docker-desktop          minikube         minikube         minikube         default
kubectl config current-context:docker-desktop
Actions:
kubectl run ubuntu --image=ubuntu:22.04 # run imageExamples:
kubectl run ubuntu --image=ubuntu:22.04 --restart=Never --command -- sleep infinity:pod/ubuntu createdImport/export configuration:
kubectl get pod <name> -o yaml # output YAMLkubectl explain pod # help on resource structurekubectl apply -k <directory> # apply Kustomize configurationExamples:
kubectl explain pod:KIND: PodVERSION: v1DESCRIPTION: Pod is a collection of containers that can run on a host. This resource is created by clients and scheduled onto hosts.FIELDS: apiVersion <string> APIVersion defines the versioned schema of this representation of an object. Servers should convert recognized schemas to the latest internal value, and may reject unrecognized values. More info: https://git.k8s.io/community/contributors/devel/sig-architecture/api-conventions.md#resources kind <string> Kind is a string value representing the REST resource this object represents. Servers may infer this from the endpoint the client submits requests to. Cannot be updated. In CamelCase. More info: https://git.k8s.io/community/contributors/devel/sig-architecture/api-conventions.md#types-kinds metadata <ObjectMeta> Standard object's metadata. More info: https://git.k8s.io/community/contributors/devel/sig-architecture/api-conventions.md#metadata spec <PodSpec> Specification of the desired behavior of the pod. More info: https://git.k8s.io/community/contributors/devel/sig-architecture/api-conventions.md#spec-and-status status <PodStatus> Most recently observed status of the pod. This data may not be up to date. Populated by the system. Read-only. More info: https://git.k8s.io/community/contributors/devel/sig-architecture/api-conventions.md#spec-and-statusInstalling Dashboard:
kubectl apply -f https://raw.githubusercontent.com/kubernetes/dashboard/v7.13.0/aio/deploy/recommended.yaml
// The latest version can be viewed athttps://github.com/kubernetes/dashboard
Namespace:
kubectl create namespace my-team # Create Namespacekubectl apply -f app.yaml -n my-team # Apply manifest to Namespacekubectl get pods -n my-team # View resources in Namespacekubectl config set-context --current --namespace=my-team # Change the active Namespace (kubectl config)Creating admin access to Dashboard:
apiVersion: v1kind: ServiceAccountmetadata: name: admin-user namespace: kubernetes-dashboard---apiVersion: rbac.authorization.k8s.io/v1kind: ClusterRoleBindingmetadata: name: admin-user-bindingroleRef: apiGroup: rbac.authorization.k8s.io kind: ClusterRole name: cluster-adminsubjects:- kind: ServiceAccount name: admin-user namespace: kubernetes-dashboardkubectl apply -f admin-user.yamlCreating a token to access the Dashboard:
apiVersion: v1kind: Secretmetadata: name: admin-user-token namespace: kubernetes-dashboard annotations: kubernetes.io/service-account.name: admin-usertype: kubernetes.io/service-account-tokenkubectl apply -f admin-user-token.yaml
// Getting a token:kubectl -n kubernetes-dashboard get secret admin-user-token -o jsonpath="{.data.token}" | ` %{ [System.Text.Encoding]::UTF8.GetString([System.Convert]::FromBase64String($_)) }Access to Dashboard:
kubectl proxy
// Open in browser:http://localhost:8001/api/v1/namespaces/kubernetes-dashboard/services/https:kubernetes-dashboard:/proxy/
Kubernetes Dashboard
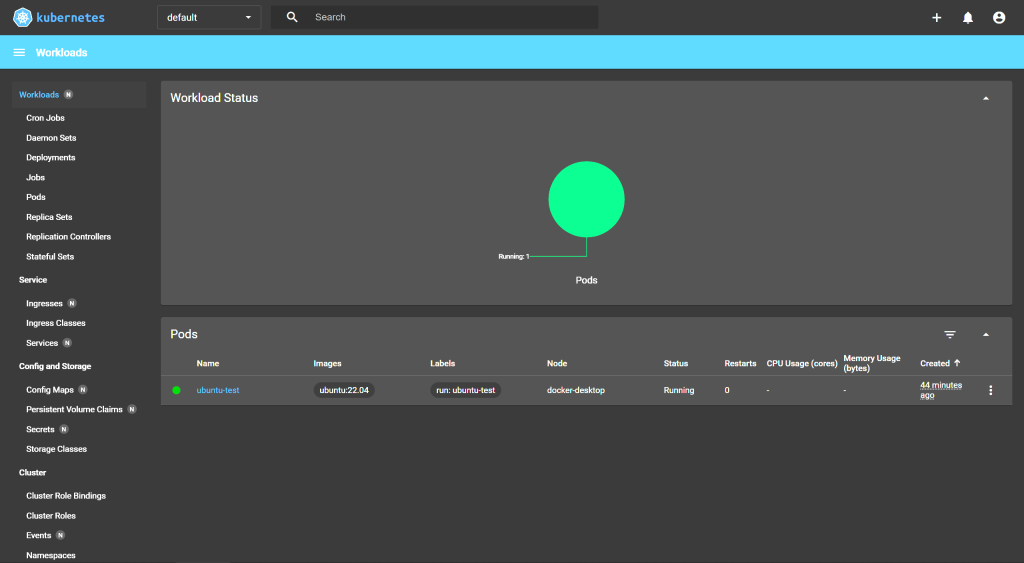
Top panel:
Namespace (default):
current namespace. You can choose another one (e.g. kube-system, kubernetes-dashboard).
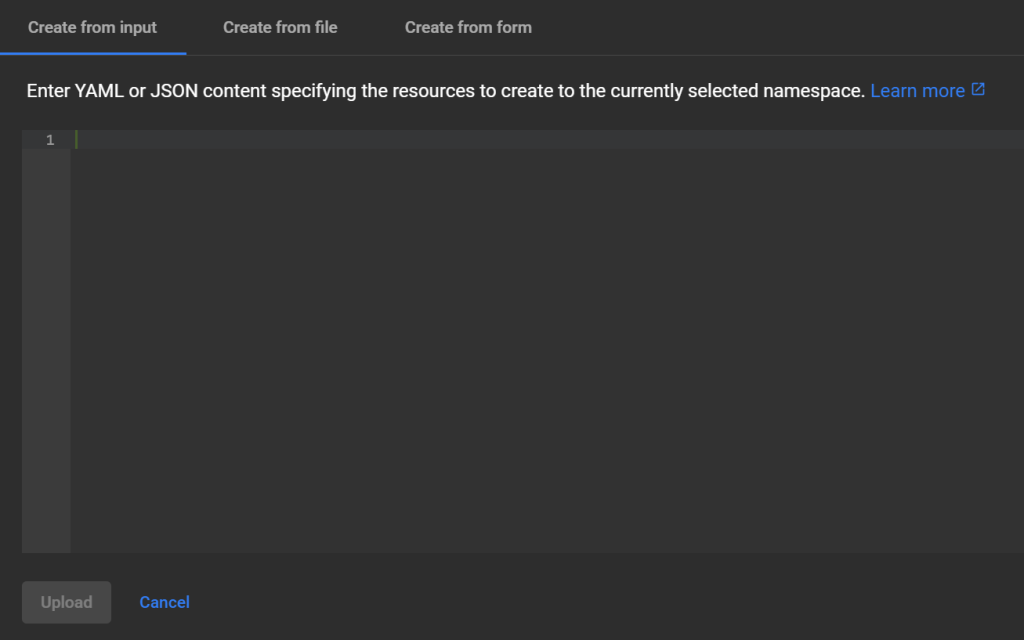
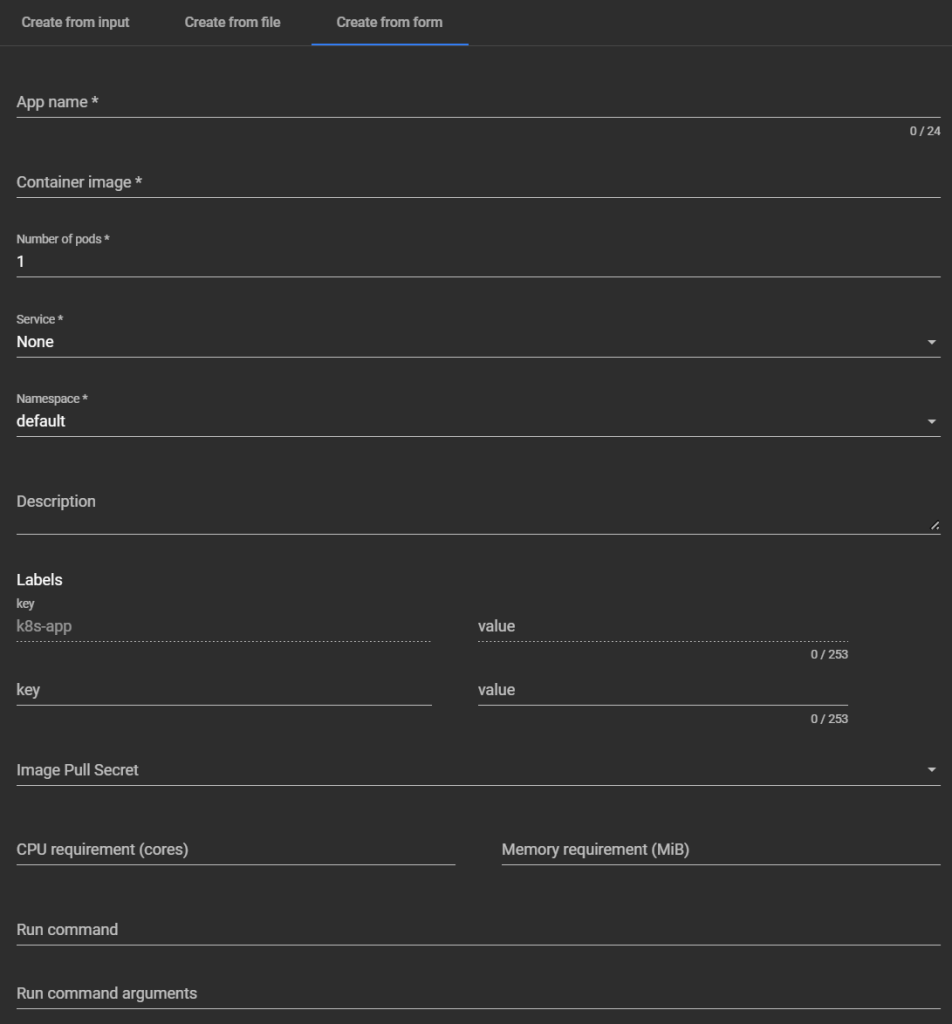
Button "+" (Create):
open form/editor to create resource (via YAML).
Sidebar:
Workloads — workloads
Cron Jobs:
Periodic tasks (analogous to cron in Linux). Runs a Job on a schedule.
Daemon Sets:
Launch a Pod on each node (or selected ones), for example for a logger, monitoring (Prometheus Node Exporter, etc.).
Deployments:
The main way to deploy applications. Manages the number of Pod replicas, updates, rollbacks.
Jobs:
One-time tasks that run to completion (e.g. database migrations, report generation).
Pods:
Basic execution units are container wrappers. Can be run separately or via controllers (Deployments, etc.).

Replica Sets:
Provides the required number of identical Pods. Typically created and managed via Deployment.
Replication Controllers:
Deprecated predecessor of ReplicaSet. Not used in modern clusters.
Stateful Sets:
Controllers for Pods with unique names, stable volumes and consistent scaling (used in DB, Kafka, etc.).
Service - access to applications
Ingresses:
Rules for routing HTTP(S) traffic to Pods via single sign-on. Works with Ingress Controller (e.g. nginx, traefik).
Ingress Classes:
Defines the types of Ingress controllers. Allows using different implementations (e.g. nginx, istio, haproxy) simultaneously.
Services:
Objects that provide network access to Pods (type ClusterIP, NodePort, LoadBalancer).

Config and Storage - configuration and storage
Config Maps:
Store configuration as key-value. Included in Pods as environment variables or files.

Persistent Volume Claims:
Persistent Storage (PV) requests. Associated with Persistent Volumes.
Secrets:
Storage of sensitive data (passwords, tokens, keys). Can be mounted in containers or used as variables.
Storage Classes:
Determine how and where to create storage (e.g. manually or dynamically in the cloud).

Cluster - cluster management
Cluster Role Bindings:
Associate a ClusterRole with a user or ServiceAccount at the cluster-wide level.
Cluster Roles:
Define permission sets (RBAC) at the cluster level.
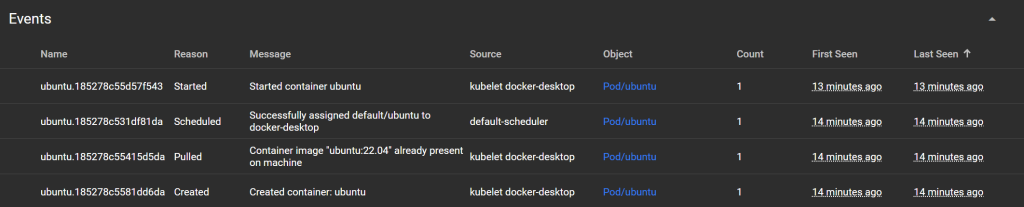
Events:
System events in the cluster: resource creation/deletion, errors, Pod restarts, etc.
Namespaces:
Logical isolation of resources (eg: default, kube-system, dev, prod). Useful for separating access and environments.
Network Policies:
Defines the rules of network interaction between Pods. Analogous to a firewall inside a cluster.
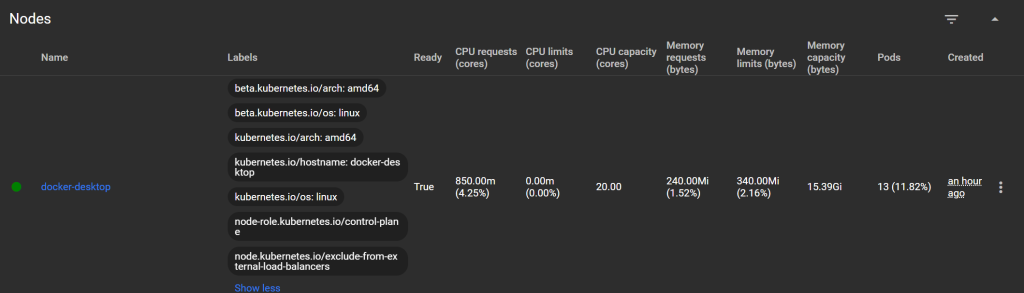
Nodes:
Physical or virtual machines that run Pods.
Persistent Volumes:
Physical storage available to Pods (local, NFS, cloud).
Role Bindings:
Binding Role (namespace-restricted) to subjects (SA, users).
Roles:
Permission sets (RBAC) within a single namespace.
Service Accounts:
Accounts used by Pods to interact with the Kubernetes API (e.g. for CI/CD or internal authentication).
Custom Resource Definitions (CRD):
Kubernetes API extension. Allows you to add your own resources (e.g. HelmRelease, PrometheusRule, KedaScalers, etc.).
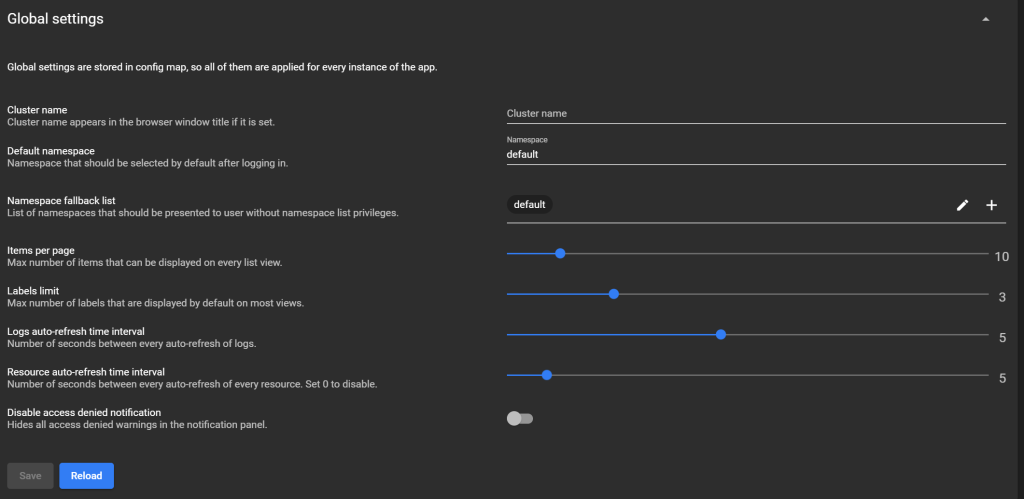
Settings:
Dashboard interface settings (theme, language, behavior).
About:
Information about the Kubernetes Dashboard version, its components, and dependencies.
How to monitor the health of services
Probes (health check):
Add livenessProbe and readinessProbe to the container. Kubernetes will monitor the Pod's health and restart it if it fails. But these checks only restart the Pod, they don't send notifications.
livenessProbe:  httpGet:    path: /health    port: 8080  initialDelaySeconds: 5  periodSeconds: 10
readinessProbe:  httpGet:    path: /ready    port: 8080  initialDelaySeconds: 3  periodSeconds: 5
Notifications via Prometheus + Alertmanager:
The most flexible way is to use Prometheus with Alertmanager.
Steps:
Install Prometheus + Alertmanager (via Helm)
Set up metrics collection from kubelet, kube-state-metrics, or the application itself
Create alerting rules
Connect recipients: Email, Slack, Telegram, Webhook
Alert example:
groups:- name: kube-alerts rules: - alert: PodDown expr: kube_pod_status_phase{phase="Running"} == 0 for: 1m labels: severity: critical annotations: summary: "Pod {{ $labels.pod }} is down" description: "Pod {{ $labels.pod }} in namespace {{ $labels.namespace }} is not running"Webhooks via Kubernetes Events (event listening):
You can use Event-Listener (for example k8s-event-exporter):
Listens to kubectl get events
Sends to Slack, Webhook, Elasticsearch, etc.
receivers: - name: "slack" slack: webhook: "https://hooks.slack.com/services/..." username: "k8s-event-exporter" icon_emoji: ":kubernetes:"Connecting to CI/CD (e.g. Argo CD, GitLab):
If you are using ArgoCD or GitLab/Kubernetes CI:
You can set up a hook when the Deployments/Pod status changes
And launch notifications via Telegram, Discord, etc.
Prometheus
It is an open-source monitoring and alerting system designed to collect metrics from applications and services. In Kubernetes, Prometheus is used to:
collecting metrics (CPU, memory, Pod status, nodes, etc.)
visualizations (via Grafana)
notifications (via Alertmanager)
load and performance analysis
Format:
text-based, simple and readable, using Prometheus exposition format, which is exported over HTTP to an endpoint, usually /metrics.
<metric_name>{<label_key>=<label_value>, ...} <value> [<timestamp>]Examples:
Example of simple metrics:# HELP http_requests_total Number of HTTP requests# TYPE http_requests_total counterhttp_requests_total{method="GET", path="/api"} 1025http_requests_total{method="POST", path="/login"} 214
Example of system metrics:# HELP process_cpu_seconds_total CPU time consumed# TYPE process_cpu_seconds_total counterprocess_cpu_seconds_total 12.42# HELP process_memory_usage_bytes Memory usage in bytes# TYPE process_memory_usage_bytes gaugeprocess_memory_usage_bytes 4382720
Supported metric types:counter A counter that only growsgauge A value that can rise/fallhistogram Distribution of values by binssummary Statistics (sum, quantile, etc.)
Example of histogram:# HELP request_duration_seconds Response time# TYPE request_duration_seconds histogramrequest_duration_seconds_bucket{le="0.1"} 53request_duration_seconds_bucket{le="0.5"} 87request_duration_seconds_bucket{le="1"} 103request_duration_seconds_bucket{le="+Inf"} 120request_duration_seconds_count 120request_duration_seconds_sum 45.3
How Prometheus works:
Periodically polls endpoints (targets) via HTTP (/metrics)
Saves metrics to an internal database (TSDB - Time Series DB)
Provides PromQL query language for filtering and aggregation
Can trigger alerts via Alertmanager
Where it is used in Kubernetes:
What is monitored Examples of metrics
Nodes CPU, RAM, disk, status
Pods Lifetime, Restarts, Errors, Phases
Deployment / Service Number of replicas, availability
Kubernetes API latency, errors
Applications (if configured) /metrics endpoint with custom metrics
Main components:
Prometheus:
Collection and storage of metrics
Alertmanager:
Sending notifications (Slack, Email, etc.)
Grafana:
Visualization of charts and dashboards
node-exporter:
OS metrics (CPU, memory, disk, etc.)
kube-state-metrics:
Kubernetes Object State
Here are examples of typical Prometheus metrics that can be collected in Kubernetes.
Kubernetes cluster metrics:
Pod / containers:container_cpu_usage_seconds_total CPU usage in secondscontainer_memory_usage_bytes Memory usagecontainer_fs_usage_bytes Disk usagecontainer_restart_count Number of restartscontainer_last_seen Last metric update
Deployment / ReplicaSet / StatefulSet:kube_deployment_status_replicas_available How many replicas are readykube_deployment_spec_replicas How many are expected according to plankube_statefulset_status_replicas StatefulSet Replicas
Pod/status and phase:kube_pod_status_phase{phase="Running"} Number of running Podskube_pod_status_phase{phase="Pending"} Number of pending Podskube_pod_container_status_restarts_total Number of restarts
Nodes:node_cpu_seconds_total CPU loadnode_memory_MemAvailable_bytes Available memorynode_disk_io_time_seconds_total I/O timekube_node_status_condition Node status (Ready, NotReady, etc.)
Metrics of the application itself:
http_requests_total{handler="/api", method="GET", status="200"}  105my_service_errors_total{type="db"} 3job_duration_seconds{job="cleanup"} 1.25
rate(http_requests_total[1m]) # Number of HTTP requests per secondsum(my_service_errors_total) # Errors for all timeavg(job_duration_seconds) # Average task duration